
(banner: top 100 tags, proportional to their number of articles)
I am on dev.to for a while now, and I couldn’t help noticing that most of the featured articles I see are web development related (javascript, webdev), or targeted at beginners (beginners, basic git commands, etc.).
I wrote a few articles, that I consider not that bad (well, not that great either), but they don’t seem to take. Might it be because I am not writing about the things the community cares about?
Instead of staying in the dark, I tried to better understand what works and doesn’t work on dev.to. Here is a summary of my analysis.
Disclaimer
I am not a data scientist and did this in my spare time. I tried my best to stay unbiased and to clearly explain what I am doing, so you can see the potential biases and pitfalls.
The complete analysis with interactive graphs can be found at https://derlin.github.io/dev.to-is-for-web-devs-and-beginners/analysis.html
The full code is available on GitHub:
https://github.com/derlin/dev.to-is-for-web-devs-and-beginners
Feel free to run it yourself, improve it, and share your results! (Just mention my work if you write about it somewhere, and 🌟 the repo :)).
Collected data
Dimensions
I am mainly interested in four dimensions:
-
the kind of article (tags),
-
the number of articles (count),
-
the number of positive reactions (reactions), and
-
the number of comments (comments).
There are many other properties available for an article (read time, published time, etc), but I kept them aside for now.
Datasets
I gathered two different datasets using Python on November, 13 2022.
top articles
The first dataset contains the top (i.e. with the most positive reactions) 10,000 articles of all time, gathered using the https://dev.to/search/feed_content endpoint:
count=1
curl "https://dev.to/search/feed_content?class_name=Article&per_page=$count&sort_by=public_reactions_count&sort_direction=desc"
top tags
The second dataset contains the top 100 tags. For each tag, I gathered the total number of articles and the top 100 articles.
Getting the top tags can be done using the forem API:
curl https://dev.to/api/tags?per_page=100&page=0Or by scrapping the page https://dev.to/tags.
The two methods however do NOT return the same results… As the API returned 4 nonexistant tags (404 Not Found for macosapps, southafricanews, sportnews, and latestnigerianewslat), I settled on scraping the https://dev.to/tags page.
There is no API endpoint to get the number of articles per tag, but they are displayed in two places on dev.to (“XXX posts published”):
-
on the tags page https://dev.to/tags, and
-
on each tag page
https://dev.to/t/<TAG>
The problem is, they don’t match at all, (1) being often way higher than (2).
For example, at the time of writing, the archlinux tag shows “34635 posts published” on the tags page, but “151 Posts Published” on the https://dev.to/t/archlinux page… To settle this, I scrolled until there was no more new fetch, and got 181 articles.
I thus decided to rely on the number found on the tag pages (2).
ⓘ For more information on the discrepancies, see https://derlin.github.io/dev.to-is-for-web-devs-and-beginners/difference.html.
Finally, the top articles per tag can be fetched using the same https://dev.to/search/feed_content endpoint, with just an extra parameter:
count=1
# the separator is ', ', so ',%20' when url-encoded
tags_query_param='&tag_names[]=javascript,%20webdev'

curl "https://dev.to/search/feed_content?class_name=Article&per_page=$count&sort_by=public_reactions_count&sort_direction=desc&$tags_query_param"Top tags
The 100 tags listed on https://dev.to/tags at the time of writing are:
More than 30K articles:
javascript (67K), webdev (55K), beginners (43K)
Between 20K-30K articles:
tutorial, react, programming
Between 10K-20K articles:
python, discuss, productivity, css, career, node,
devops, codenewbie
Between 5K-10K articles:
html, opensource, typescript, aws, showdev, github, java,
testing, docker, php, security, linux, vue, ruby, git
Between 2K-5K articles:
angular, go, database, dotnet, csharp, serverless,
machinelearning, kubernetes, rails, computerscience,
cloud, android, design, laravel, azure, api, algorithms,
architecture, help, learning, datascience, vscode,
reactnative, graphql, frontend, nextjs, flutter,
watercooler, django, ios, codepen, sql, rust,
todayilearned, blockchain, performance
Between 1K-2K articles:
hacktoberfest, startup, kotlin, motivation, news, coding,
challenge, mongodb, development, microservices,
tailwindcss, postgres, cpp, npm, ux, gamedev, wordpress,
writing, devjournal, mobile, dart, leetcode, ai, agile,
firebase, management, tooling, meta, braziliandevs, mysql
Less than 1K articles:
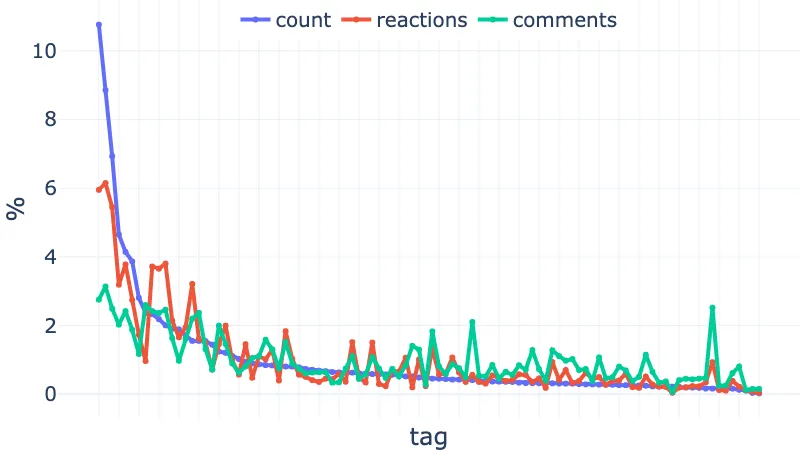
web3, community, cybersecurity, actionshackathon21, archlinuxLet’s plot the number of articles (count), reactions and comments for those 100 tags, ordered by count. As we don’t have the total number of reactions or comments available on dev.to, they are taken from the sum of the top 100 articles for each tag.
IMPORTANT: remember that an article can have up to four tags, so a very popular article can boost the scores of multiple tags!
(interactive version and interactive version without normalization)
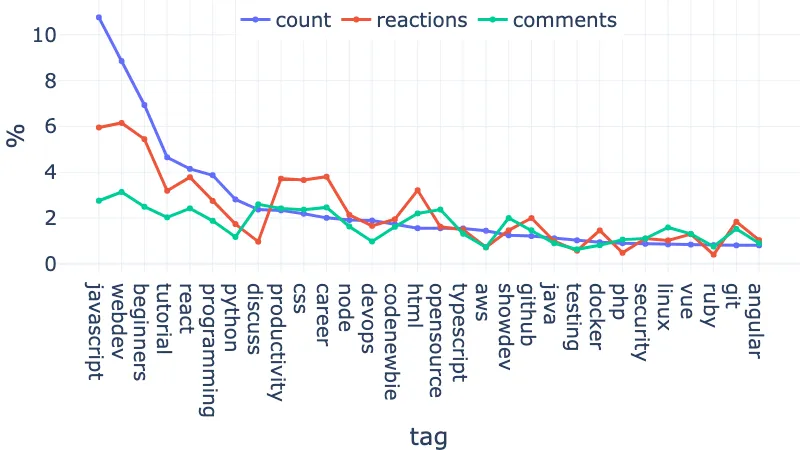
We can see that the first few tags account for most of the articles. The reactions and comments follow roughly the same trend, with high peaks and drops. Let’s zoom in on the first 30 tags:
Taking only the first 4 tags, we account for 30% of all the articles of the top 100 tags: javascript (10.76%), webdev (8.85%), beginners (6.93%), tutorial (4.65%) → 31.10%!
Looking at the peaks and drops of reactions on the full graph, some types of tags clearly generate “reaction peaks”:
-
web-related tags such as:
react,css,html,vscode,vue,frontend… -
generic tags such as:
productivity,career,computerscience,design,architecture,learning,motivation… -
github,git, anddocker, which are basic tools any (web) developer should know
On the other hand, some groups of tags show clear “reaction drops”:
-
languages/framework not web-related:
php,ruby,android,laravel,kotlin, … -
devops subjects:
devops,cloud,aws,azure, … -
datascienceandtesting(← this one was unexpected)
The top 100 articles of the top 7 tags account for 30% of all the positive reactions in the dataset: webdev (6.15%), javascript (5.95%), beginners (5.44%), career (3.80%), react (3.78%), productivity (3.72%), css (3.66%) → 32.5%.
From the comments point of view, some obvious tags have a high peak: discuss, watercooler, meta, writing, help, showdev. I am not surprised to also see peaks for tags like career or productivity. vscode has a huge comment bump, I guess because it is the editor of choice for web developers (and IDEs are sacred). I am astonished to see many comments generated by linux and opensource.
Similar to reactions, tags for languages/frameworks not web-related or devops-focus have fewer comments: python, devops, aws, testing, machinelearning, kubernetes, aws, datascience, …
Top 10,000 articles of all time
The data from the tags dataset has many flaws: the count is not guaranteed to be accurate, and the reactions and comments can only be inferred using the top 100 articles, which is far from ideal. So let’s look at the top 10,000 articles of all time instead.
Note: the oldest article in the dataset is from April 2016, the latest from November 2022, with a distribution that is quite even along those two extremes. So it isn’t just old articles!
As articles have multiple tags, let’s “explode” the dataset, so an article with 4 tags gives rise to 4 lines (one for each tag). Then, let’s group lines by tag. The distribution of count (number of articles), reactions, and comments are:
| count | reactions | comments | |
|---|---|---|---|
| mean | 21 | 7024 | 439 |
| std | 192 | 67,768 | 3,719 |
| min | 1 | 122 | 0 |
| 25% | 1 | 175 | 12 |
| 50% | 1 | 335 | 29 |
| 75% | 4 | 1,012 | 88 |
| max | 4,515 | 1,631,495 | 89,391 |
(out of 1,676 tags)
See the difference between the 75% quartile in the max? There are again a small number of tags that gather most of the attention!
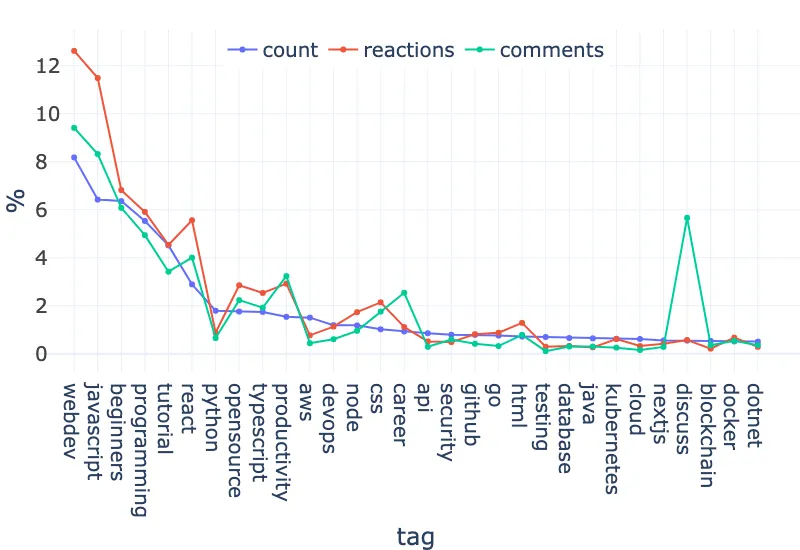
Here are the top 25 tags (normalized to show percentages across the whole dataset):
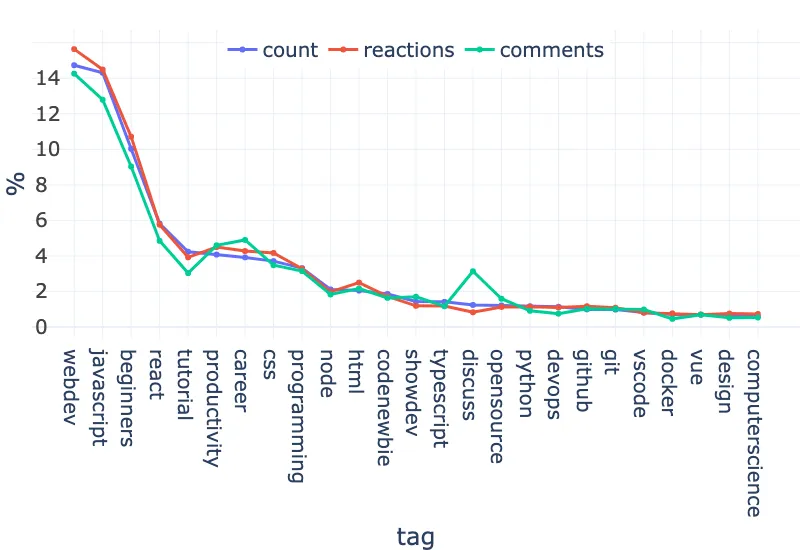
(interactive version and interactive version without normalization)
The first 7 tags, webdev, javascript, beginners, react, tutorial, productivity, career and css account for 53% of the articles, 48% of the comments, and 56% of the reactions!
But there is still a little problem. Since articles have up to four tags, a very successful article will boost the scores of multiple tags…
So instead, let’s count articles only once. That is, if an article has multiple tags, we will keep only the most “successful” one, that is the one with the highest value for count, reactions, or comments (depending on the criterion under analysis).
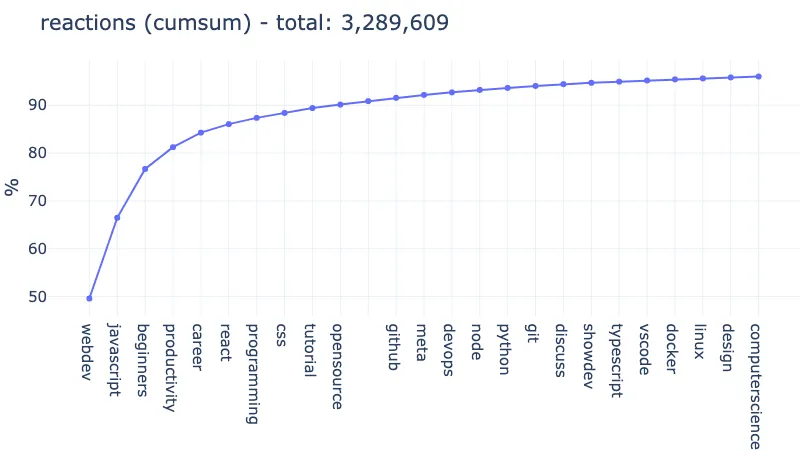
Using a normalized cumulative sum, this is what we get for the number of articles:
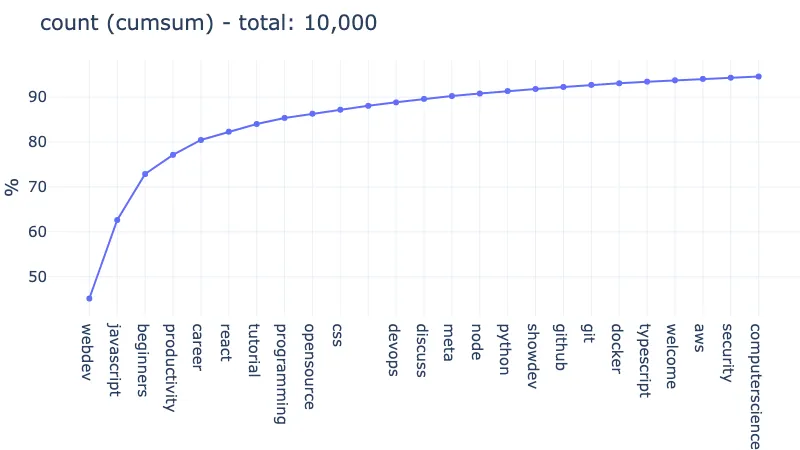
webdev and javascript cover 62% of the articles (6K out of 10K)! Adding only beginners, productivity, and career cover 80%.
The same trend can be seen for reactions (66% for webdev and javascript, 84% adding the 3 other tags):
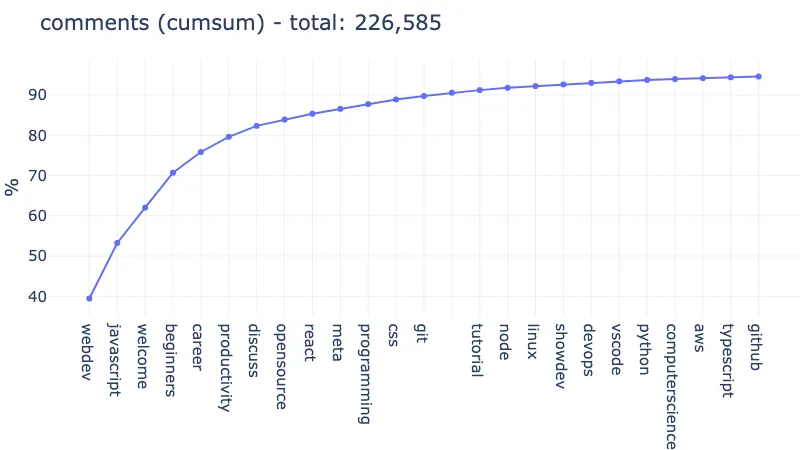
For comments, we just have the welcome tag that inserts itself in the 3rd place. The rest of the top 6 is left mostly unchanged:
bonus: Top 5,000 articles of the last month
The oldest the article, the higher its opportunity to have gained traction. Maybe the trend has changed since the beginning of dev.to ?
To ensure the conclusions based on the top articles dataset is correct, I reran the analysis notebook using a slightly modified top articles dataset: the top 5K articles between October, 16 and November, 16 2022.
{%collapsible How I fetched the data %} I haven’t committed the results, but you can get similar data yourself by adding a published_at[gte]=<isodate> parameter to the https://dev.to/search/feed_content query.
Note that I tried to add a published_at[lte] parameter as well, but it doesn’t seem to work…
I ran it on November, 16 and used the following query parameter:
published_at%5Bgte%5D=2022-10-16T06%3A52%3A04Zto get the articles in the last month. {%endcollapsible %}
Here are the top 25 tags that appear in this new dataset (out of 1,487):
(Tags of the top 5K articles between Oct, 16 and Nov, 16)
Counting articles only once, 60% of the top articles of last month are covered by: webdev (23.92%), <no tag> (14.12%), beginners (9.94%), javascript (8.38%), programming (5.50%) → 61.86%.
60% of the reactions on the top articles of last month are covered by: webdev (43.91%), javascript (10.68%), beginners (8.35%) → 62.93%.
Finally, 60% of the comments are covered by: webdev (29.01%), discuss (15.12%), welcome (9.66%), javascript (9.31%) → 63.10%.
There is not much change in the trend compared to the top 10K articles of all time, except for a rise of articles without any tags.
Conclusion
However we look at it, webdev, javascript and beginners are by far the most prolific tags on dev.to. They account for more than 50% of the top 10K articles of all time, and have more comments and positive reactions than any other tag.
webdev alone covers 12% of the 10K top articles of all time, 20% of the top 5K articles of last month.
Just after, we find tags like productivity and career, which also take a big part of the cake.
Looking at other successful tags, we find mostly webdev-related tags (react, vscode, etc), beginner-friendly tags (codenewbie, tutorial, etc), and generic tags (programming, opensource, etc).

(tag cloud based on the tags appearing in the top 10K articles on dev.to)
More specific tags (not webdev-related) are also present in the top articles, but represent a small proportion and have in general fewer interactions.
#### Weaker assertions
For the rest, the trend is fuzzier, as results from the top tags dataset and the top articles datasets do not always match. After staring at the data for a while (especially the top tags datasets), my feeling is that “successful” articles on dev.to are mostly:
-
web development and web framework articles,
-
beginner articles for “newbies”,
-
generic articles for productivity and career / tips and tricks,
-
generic articles on coding (programming, computer science),
-
technologies and tools that are used by all developers, but especially web devs (docker, git, github, vs code).
While other languages (especially compiled ones) and frameworks that web developers do not use on a daily basis or more advanced topics are fewer / trigger less reactions and comments (kotlin, php, devops, datascience, machine learning, …).
In other words, if you are not a web developer and like to write highly technical articles, it may be hard to shine on dev.to (this doesn’t mean you shouldn’t contribute!)
This is just my analysis though, and maybe you will disagree after staring yourself at the full analysis. Let me know in the comments !